As electric vehicles become more common on American roads, the need for reliable charging infrastructure has never been greater. To help consumers understand the state of EV charging stations, Alan’s Factory Outlet reviewed national datasets from the U.S. Department of Energy and industry reports, mapping out where charging ports are located, how costs compare, and what challenges remain.
By breaking down availability by state, city, and charging type, this guide provides a clear look at how drivers can plan for charging access today, and how federal and state programs are shaping the future of fueling stations nationwide.
Key Takeaways
- California has the most public EV charging ports at 60,128, which is over 3x as many as New York and roughly 26% of the national total.
- The top 5 states (CA, NY, FL, TX, MA) hold about 50% of all public EV charging ports.
- Los Angeles leads with 8,152 public EV charging ports, well ahead of San Diego (2,742), San Jose (2,102), Atlanta (1,959), and New York City (1,937).
- Smaller EV markets with relatively high plug availability per driver: North Dakota (273) and Wyoming (270) have the most ports per 1,000 EVs, followed by Maine (199) and West Virginia (195).
- California (48), Florida (50), Texas (51), and Washington (49) are mid-to-low on ports per 1,000 EVs due to much higher EV adoption.
- Charging mostly at home costs about $700 per year, roughly 3x cheaper than relying on public DC fast charging, which can exceed $2,000 per year.
Where America’s EV Charging Ports Are Located
Public charging stations aren’t spread evenly across the U.S. Some regions are well connected, while others face long gaps in availability. Mapping out ports per vehicle and per state reveals both the strengths of today’s charging infrastructure and where more investment is needed.
States With the Most Public EV Charging Ports
- California: 60,128
- New York: 17,928
- Florida: 12,849
- Texas: 11,625
- Massachusetts: 9,901
- Washington: 7,413
- Colorado: 6,532
- Georgia: 6,398
- North Carolina: 5,502
- Pennsylvania: 5,426
According to the U.S. Department of Energy, California leads the country by a wide margin with 60,128 public charging ports — more than triple New York’s 17,928. California alone makes up about 26% of all charging ports nationwide. Together with New York, Florida, Texas, and Massachusetts, the top 5 states account for about 50% of the entire U.S. network.
Looking at the median gives a sense of how lopsided this growth has been. The midpoint stands at around 1,999 ports per state, far below the national average of 4,540. That average is pulled higher largely because of California’s outsized contribution.
States With the Fewest Public EV Charging Ports
- Alaska: 163
- North Dakota: 262
- South Dakota: 305
- Wyoming: 308
- Montana: 460
- West Virginia: 538
- Mississippi: 613
- Idaho: 625
- Nebraska: 679
- Delaware: 755
The West Coast and Northeast are generally strong in charging infrastructure, as are Sun Belt states like Florida, Texas, and Georgia. By contrast, rural regions, including Alaska, North Dakota, South Dakota, Wyoming, and Montana, had the fewest EV charging ports, showing longer gaps in coverage.
U.S. Cities With the Most Public EV Charging Ports
- Los Angeles, CA: 8,152
- San Diego, CA: 2,742
- San Jose, CA: 2,102
- Atlanta, GA: 1,959
- New York, NY: 1,937
- Seattle, WA: 1,766
- Austin, TX: 1,764
- Irvine, CA: 1,691
- Boston, MA: 1,618
- Sacramento, CA: 1,482
City-level data showed a similar pattern. Los Angeles led all U.S. cities with 8,152 charging ports, followed by San Diego (2,742) and San Jose (2,102). The next tier included Atlanta (1,959) and New York City (1,937), highlighting how major metropolitan areas are hubs for charging infrastructure.
States With the Most Public EV Charging Ports per 1,000 EVs
- North Dakota: 273.2
- Wyoming: 270.4
- Maine: 198.7
- West Virginia: 195.1
- South Dakota: 182.1
- Mississippi: 170.8
- Vermont: 167.0
- Arkansas: 148.7
- Connecticut: 141.3
- New York: 136.6
When measuring ports per 1,000 registered EVs, smaller markets sometimes came out ahead. This metric simply compares how many charging plugs are available relative to the number of electric vehicles on the road. In other words, a state might not have a lot of total charging stations, but if it has very few EVs, each driver has more plugs to choose from. By this measure, North Dakota and Wyoming ranked highest, followed by Maine and West Virginia.
States With the Fewest Public EV Charging Ports per 1,000 EVs
- Hawaii: 36.7
- New Jersey: 38.6
- California: 47.9
- Washington: 48.7
- Illinois: 48.8
- Arizona: 49.1
- Florida: 50.4
- Texas: 50.5
- Nevada: 53.5
- Alaska: 60.4
On the other hand, states with very high EV adoption, such as California, Florida, Texas, and Washington, had relatively low ratios, with fewer than 52 ports per 1,000 EVs. This contrast reflects how fast-growing adoption can outpace buildout in major EV states, while smaller markets maintain more plugs per driver because the demand is lighter.
Federal programs are working to close these gaps. The National Electric Vehicle Infrastructure (NEVI) program directs funding toward new DC fast charging corridors, requiring at least four 150 kW ports per site and spacing locations about every 50 miles on key highways. This effort is especially important for rural and underserved states, where corridor charging remains limited.
Picking the Right EV Charger
Not all electric vehicle charging stations work the same way. The U.S. charging network is built around three main levels of chargers, each with different speeds, costs, and use cases. Knowing the differences helps drivers choose the right charging option at home, on the road, or at work.
Level 1 charging is the simplest option. It uses a standard household outlet and can be installed with little or no extra equipment. Because it’s slower, this type of charger is best for renters or homeowners who drive fewer miles each day and can let their vehicle recharge overnight. While it isn’t widely found at public stations, it can be useful in garages, driveways, or workplaces.
Level 2 charging strikes a balance between speed and accessibility. These chargers are common in public places like shopping centers, offices, and parking lots, and they can also be installed in homes with landlord approval.
DC fast charging (DCFC) is the fastest and most powerful option, often located at highway rest stops, fueling stations, or near major commercial hubs. These high-power chargers can add hundreds of miles of range in under an hour, making them essential for long trips. However, they’re rarely available at home, and costs are higher since they typically operate on a pay-per-use basis. Networks like Tesla Supercharger, Electrify America, and EVgo provide many of these stations across North America, often accessible through a mobile app.

The International Energy Agency has reported that over 85% of U.S. EV owners have access to home charging. According to the U.S. Department of Energy, most EV drivers charge at home (often overnight) using either Level 1 or Level 2 setups. However, many renters and people without dedicated parking rely more heavily on public stations.
Public charging infrastructure has grown significantly in recent years. From 2019 to 2024, the number of non-home chargers (public + workplace) increased at about 25% per year, rising to about 204,000 nationwide by the end of 2024. During that time, Level 2 chargers expanded by 29%, while DC fast chargers grew by 56%, reflecting a demand for faster fueling options.
Even with this rapid growth, challenges remain, especially in rural areas. The U.S. Department of Transportation notes that drivers in remote regions often face longer distances between charging locations, unreliable or out-of-service chargers, and reduced battery performance in extreme weather. These hurdles can create real concerns for drivers traveling outside dense urban corridors.
Why Shelter Matters for EV Charging: Garages and Solar Carports
Cold weather adds another layer of difficulty, as EVs lose range in freezing temperatures. At home, a garage or covered carport can help keep snow, ice, and wind off the vehicle, making charging more reliable and comfortable. Providing shelter for home charging equipment also helps protect the hardware itself, reducing wear and extending its lifespan.
Another option is a solar carport, which combines vehicle protection with renewable energy. Solar panels installed on the roof generate electricity to power EVs, offset home energy use, and can even send excess back to the grid. This structure not only shields cars and equipment but also lowers charging costs and supports a cleaner energy system.
What It Costs to Charge
One of the biggest considerations for EV drivers is how much it costs to keep their vehicle powered. Charging electric vehicles at home remains the most affordable option, while public charging prices vary depending on charger type and provider.
On average, charging an EV at home averages around 17 cents per kilowatt-hour (kWh), or about $6.80 for a full 40 kWh battery. That works out to roughly 5 cents per mile, making home charging about three times cheaper than relying on public DC fast chargers. For most drivers, this adds up to about $700 per year in charging costs.
Public charging can be more expensive. Level 2 chargers usually cost 20–25 cents per kWh, or $8–$10 for a full charge. DC fast chargers, often located along highways or at fueling stations, range between 40–60 cents per kWh, which can raise the cost of a full charge to $16–$24. Drivers who rely solely on DC fast charging could spend over $2,000 per year, nearly triple the cost of home charging.
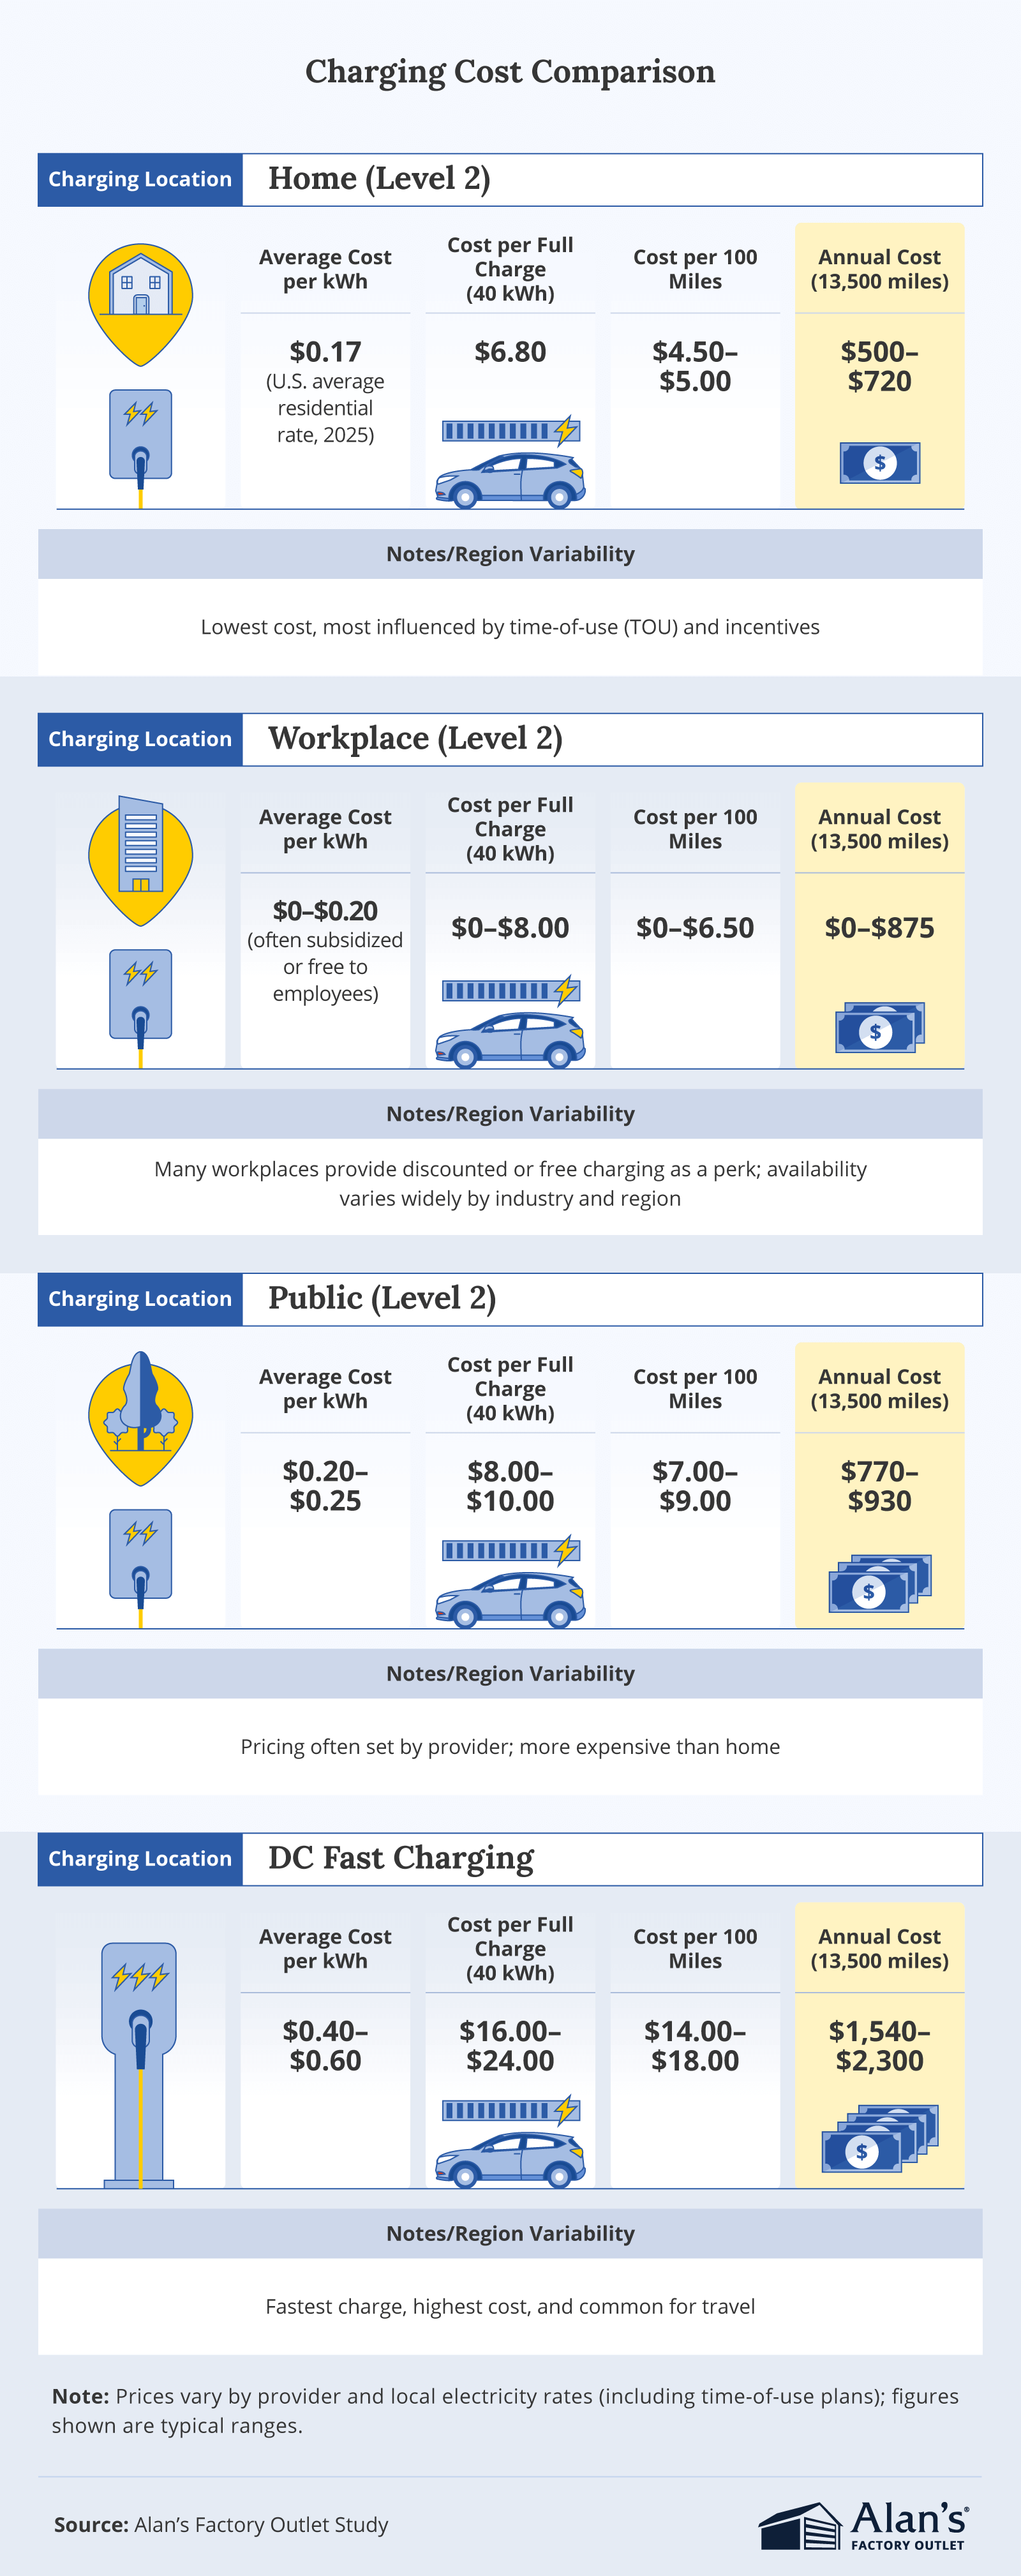
Costs also vary based on the provider and utility. Networks such as Tesla Supercharger, Electrify America, EVgo, and ChargePoint each set different rates. Some utilities offer incentives, time-of-use pricing, or membership programs that lower costs when charging during off-peak hours. These options can make a big difference for frequent drivers.
Beyond pricing, the clean energy mix powering the grid matters. According to the EIA, states like California, Washington, and Massachusetts generate a significant share of their electricity from renewables such as solar and wind. Charging in these regions can further reduce a driver’s carbon footprint. By combining charging maps with clean energy data, policymakers and consumers can better understand not only where EV charging is available, but also how sustainable it is.
Conclusion: How to Use This Guide
Electric vehicle charging in the U.S. is growing quickly, but it’s not evenly spread. Big states like California, New York, and Texas lead the way with the most charging ports, while less populated states such as North Dakota and Wyoming actually give drivers more plugs per vehicle. For most owners, charging at home is still the easiest and cheapest option, while public fast chargers are best for road trips and long-distance travel.
To get the most out of this guide, think about your own charging needs and location. Home charging can keep yearly costs around $700 (depending on local rates and vehicle efficiency), while relying only on fast chargers could cost three times as much. Cold climates add another layer of planning, making vehicle shelters and reliable plugs even more valuable. Whether you’re a new EV driver or already on the road, the big takeaway is simple: plan ahead, protect your equipment, and look for ways to cut costs with local programs and clean energy options.
Methodology
This guide draws on national datasets and authoritative federal and industry sources to provide a comprehensive picture of EV charging infrastructure in the United States. We mapped public EV charging availability by state and city, explained charging levels, and compared costs and clean energy integration using the sources below.
- U.S. Department of Energy: Alternative Fuels Data Center (AFDC) Station Locator/Database (2025)
- U.S. Department of Energy: AFDC Home and Workplace Charging Guidance
- AFDC: Electric Vehicle Registrations by State: Used to produce the new “EV Charging Ports per 1,000 EVs” metric
- International Council on Clean Transportation (ICCT), “U.S. Charging Infrastructure Deployment Through 2024”
- Green Energy Consumers Alliance, EVBox, ChargeLab
- AAA Fuel Prices: EV Charging Prices by State (Sept 2025 update)
- Qmerit: “Cost Analysis of EV Home Charging vs. Public Charging” (Aug 2025)
- U.S. Energy Information Administration (EIA): State Renewable Energy Profiles (2025)
- Federal Highway Administration (FHWA), NEVI Standards and Requirements (2023)
About Alan’s Factory Outlet
Alan’s Factory Outlet provides durable, affordable structures such as metal garages, carports, and storage buildings that protect vehicles and equipment from the elements. As more drivers make the switch to electric vehicles, these shelters can help safeguard charging equipment and provide a reliable place to power up at home.
Fair Use Statement
The information in this article may be shared for noncommercial purposes only. If you use this content, please provide a link with proper attribution to Alan’s Factory Outlet.