The United States is vast, with long stretches of road between major cities and many opportunities for recreation and exploration spread far and wide. How many miles of road are there in the United States to accommodate its monumental size? There are approximately 4 million miles of road in America! With all those roads, there must be drivers using them to work and play. So how many drivers are in the United States? According to the Office of Highway Administration, there are 228,915,520 licensed drivers in the United States, which is around 70% of the total population. Of course, as with all statistics, this varies by state. The team at Alan’s Factory Outlet explored the data to discover the U.S. states with the most drivers per capita:
Click the image to expand
Want to display this on your website? You can copy this and paste it into your website.
Which state has the most drivers per capita?
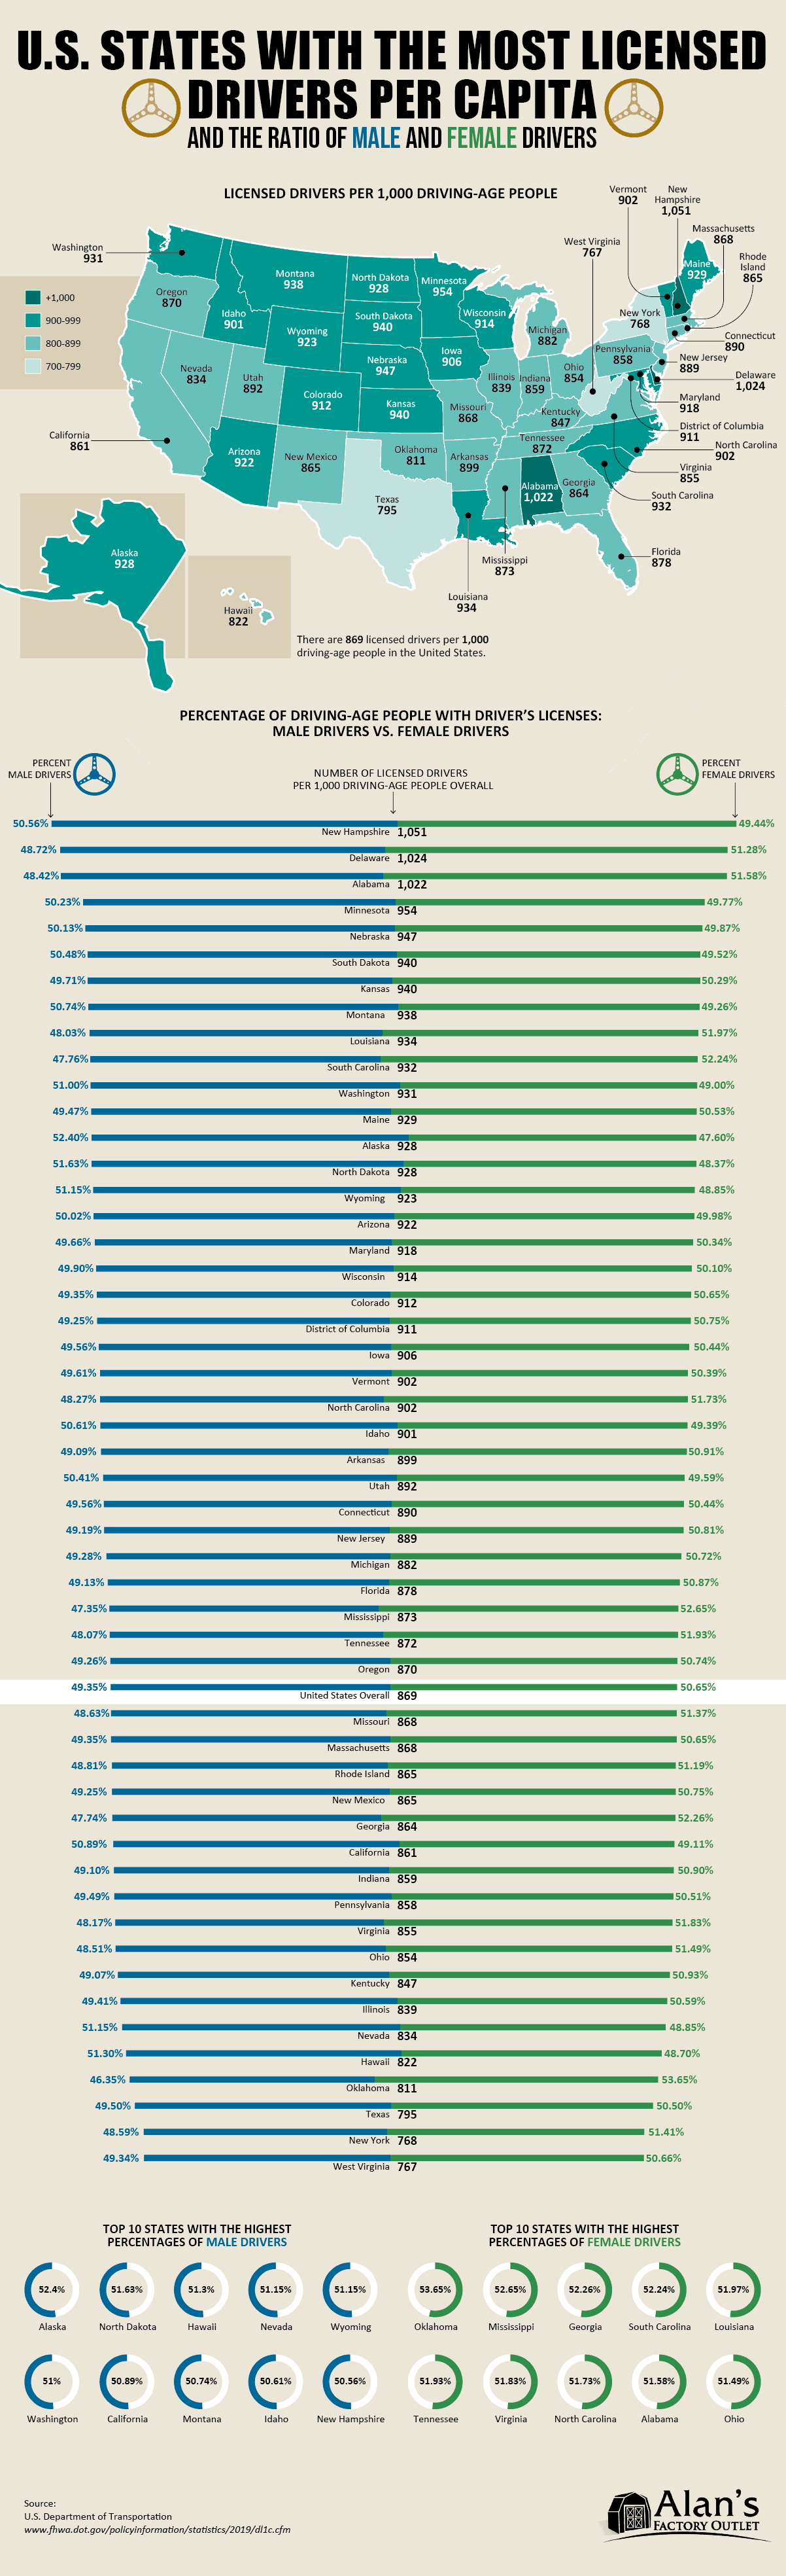
Which state has the most drivers? The state with the most drivers per capita is New Hampshire, which has 1,051 drivers per 1,000 people of driving age. How is it possible to have more than 1,000 drivers per 1,000 driving-age individuals? The Federal Highway Administration doesn’t make that clear but we suspect it has to do with data sets that do not perfectly overlap. Regardless, with all of those drivers, you may wonder, “does New Hampshire have good drivers?” According to a recent study by QuoteWizard.com, which analyzed over 2 million insurance quotes, New Hampshire has the best drivers in the nation! The study included data on the number of accidents, speeding tickets, citations, and DUIs. However, New Hampshire ranks last for wearing seatbelts, so that is a definitely an issue that needs to be worked on. New Hampshire driving routes are renowned for their breathtaking scenery; iconic New Hampshire scenic drives include the Kancamagus Highway and the Mount Washington auto road. Let’s take a lot at the top 15 states with the most drivers per capita (based on 1,000 people of driving age):
- New Hampshire drivers per capita – 1,051
- Delaware drivers per capita – 1,024
- Alabama drivers per capita – 1,022
- Minnesota drivers per capita – 954
- Nebraska drivers per capita – 947
- South Dakota drivers per capita – 940
- Kansas drivers per capita – 940
- Montana drivers per capita – 938
- Louisiana drivers per capita – 934
- South Carolina drivers per capita – 932
- Washington drivers per capita – 931
- Maine drivers per capita – 929
- Alaska drivers per capita – 928
- North Dakota drivers per capita – 928
- Wyoming drivers per capita – 923
Which state has the most female drivers?
The state with the most female drivers is Oklahoma, where 53.65% of the total drivers are female. How many female drivers are there in the United States? According to Statista, there are approximately 115.6 million female licensees compared to 112.6 million male licensees. So are there more male drivers than female drivers? No! We won’t get into genders and driving debates, but the numbers are clear about the ratio of male to female drivers in the United States.
Which state has the most male drivers?
The state with the most male drivers is Alaska, which has 52.40% male drivers.
Be sure to check out our other fascinating auto-related infographics, such as the longest and shortest interstate highways across the United States. If you are a driver yourself, we have also created a guide to 15 hazards and elements that can damage your car and how to prevent them. Garages can keep your car safe!
U.S. States With the Most Licensed Drivers per Capita and the Ratio of Male and Female Drivers
| PERCENT | PERCENT | PER 1,000 | ||
| OF TOTAL | OF TOTAL | DRIVERS | POPULATION | |
| STATE | MALE DRIVERS | FEMALE DRIVERS | TOTAL | DRIVING AGE |
| Alaska | 52.40 | 47.60 | 529,281 | 928 |
| North Dakota | 51.63 | 48.37 | 556,064 | 928 |
| Hawaii | 51.30 | 48.70 | 943,173 | 822 |
| Wyoming | 51.15 | 48.85 | 424,115 | 923 |
| Nevada | 51.15 | 48.85 | 2,054,421 | 834 |
| Washington | 51.00 | 49.00 | 5,711,136 | 931 |
| California | 50.89 | 49.11 | 27,213,650 | 861 |
| Montana | 50.74 | 49.26 | 811,851 | 938 |
| Idaho | 50.61 | 49.39 | 1,252,535 | 901 |
| New Hampshire | 50.56 | 49.44 | 1,195,211 | 1,051 |
| South Dakota | 50.48 | 49.52 | 648,663 | 940 |
| Utah | 50.41 | 49.59 | 2,121,099 | 892 |
| Minnesota | 50.23 | 49.77 | 4,273,027 | 954 |
| Nebraska | 50.13 | 49.87 | 1,430,818 | 947 |
| Arizona | 50.02 | 49.98 | 5,369,210 | 922 |
| Wisconsin | 49.90 | 50.10 | 4,296,646 | 914 |
| Kansas | 49.71 | 50.29 | 2,154,260 | 940 |
| Maryland | 49.66 | 50.34 | 4,463,862 | 918 |
| Vermon | 49.61 | 50.39 | 472,633 | 902 |
| Iowa | 49.56 | 50.44 | 2,274,431 | 906 |
| Connecticut | 49.56 | 50.44 | 2,608,061 | 890 |
| Texas | 49.50 | 50.50 | 17,822,760 | 795 |
| Pennsylvania | 49.49 | 50.51 | 8,987,676 | 858 |
| Maine | 49.47 | 50.53 | 1,046,129 | 929 |
| Illinois | 49.41 | 50.59 | 8,546,932 | 839 |
| Colorado | 49.35 | 50.65 | 4,235,384 | 912 |
| Total | 49.35 | 50.65 | 228,915,520 | 869 |
| Massachusetts | 49.35 | 50.65 | 4,950,056 | 868 |
| West Virginia | 49.34 | 50.66 | 1,130,389 | 767 |
| Michigan | 49.28 | 50.72 | 7,141,494 | 882 |
| Oregon | 49.26 | 50.74 | 3,002,014 | 870 |
| Dist. of Col. | 49.25 | 50.75 | 535,579 | 911 |
| New Mexico | 49.25 | 50.75 | 1,449,711 | 865 |
| New Jersey | 49.19 | 50.81 | 6,377,413 | 889 |
| Florida | 49.13 | 50.87 | 15,560,628 | 878 |
| Indiana | 49.10 | 50.90 | 4,589,405 | 859 |
| Arkansas | 49.09 | 50.91 | 2,153,929 | 899 |
| Kentucky | 49.07 | 50.93 | 3,030,329 | 847 |
| Rhode Island | 48.81 | 51.19 | 761,046 | 865 |
| Delaware | 48.72 | 51.28 | 812,529 | 1,024 |
| Missouri | 48.63 | 51.37 | 4,274,389 | 868 |
| New York | 48.59 | 51.41 | 12,194,360 | 768 |
| Ohio | 48.51 | 51.49 | 8,032,792 | 854 |
| Alabama | 48.42 | 51.58 | 4,026,151 | 1,022 |
| North Carolina | 48.27 | 51.73 | 7,620,001 | 902 |
| Virginia | 48.17 | 51.83 | 5,888,196 | 855 |
| Tennessee | 48.07 | 51.93 | 4,786,973 | 872 |
| Louisiana | 48.03 | 51.97 | 3,435,168 | 934 |
| South Carolina | 47.76 | 52.24 | 3,877,968 | 932 |
| Georgia | 47.74 | 52.26 | 7,261,266 | 864 |
| Mississippi | 47.35 | 52.65 | 2,058,036 | 873 |
| Oklahoma | 46.35 | 53.65 | 2,522,670 | 811 |
Top 10 States With the Highest Percentages of Female Drivers
| State | Percentage |
| Oklahoma | 53.65 |
| Mississippi | 52.65 |
| Georgia | 52.26 |
| South Carolina | 52.24 |
| Louisiana | 51.97 |
| Tennessee | 51.93 |
| Virginia | 51.83 |
| North Carolina | 51.73 |
| Alabama | 51.58 |
| Ohio | 51.49 |
Top 10 States With the Highest Percentages of Male Drivers
| State | Percentage |
| Alaska | 52.4 |
| North Dakota | 51.63 |
| Hawaii | 51.3 |
| Nevada | 51.15 |
| Wyoming | 51.15 |
| Washington | 51 |
| California | 50.89 |
| Montana | 50.74 |
| Idaho | 50.61 |
| New Hampshire | 50.56 |
Source:
U.S. Department of Transportation (https://www.fhwa.dot.gov/policyinformation/statistics/2019/dl1c.cfm)